Hôm qua vừa mới nhắc về vụ làm BI sample để làm portfolio thì hôm nay có kết quả luôn rồi.
“Sau khi review lại tập data set và Logic Tree thì thấy idea phân tích rất đầy đủ và chi tiết cho lĩnh vực HR
Bên mình mong muốn được tiếp tục làm việc với bạn ở step tiếp theo là xây dựng Dashboard cho tập dataset và logic tree bạn đã gửi.”
Uiiii, mình vui kiểu như nhận được thông báo là vô đội tuyển học sinh giỏi vậy á =)) Mà vui nhất là, cái ý tưởng của mình được xem là đầy đủ và chi tiết :3 Mình chọn đề tài chật vật lắm á, vì các chủ đề quen thuộc có nhiều dữ liệu như Marketing, thị trường đồ… thì mình chưa từng làm, nên không biết trong đó vấn đề cần phân tích là gì hết trơn. Lĩnh vực mà mình làm mấy năm rồi là Quản lý đào tạo, thuộc bộ phận Nhân sự, trong khi các vấn đề thường được mổ xẻ trong People Analytics lại nằm bên Compensation & Benefit, Talent Acquisition với Employee Engagement cơ. Mình cố gắng bù đắp bằng việc đọc rất nhiều sách về People Analytics và các kiến thức tổng quát trên hiệp hội nghề nhân sự (SHRM, CIDP), hỏi thêm các anh chị HRD mà mình có quen nữa. Được thầy giáo cũ nhận xét là ý đầy đủ và chi tiết thì cũng có thể coi như là một sự công nhận cho nỗ lực học hành của mình rồi ^^
Nhưng mà niềm vui tới đó thôi à, khó khăn ập tới rồi đây. Đầu tiên, cái tool được yêu cầu làm là Power BI, mà mình đã không xài đồ Windows từ lâu rồi -_- Nhưng thôi không sao, mình còn một cái máy Windows, lôi ra xài lại, cộng với học thêm trên LinkedIn Learning chắc không đến nỗi. Cái khó khăn thứ hai là làm Data model dạng star, trong khi cái file này thì mình nghĩ không có đủ dữ liệu để làm bảng DIM và FACT theo kiểu transactional như mình hay làm. Cái này thì chịu, đành đi hỏi thôi. Mình nhắn hỏi là, nếu không làm được data model thì làm dạng flat table được không; và có thể cho mình xin lời khuyên về việc build data model như thế nào với dữ liệu không có ngày tháng như vậy.
Lúc soạn mail, mình nghĩ tới mình của 7 năm trước và những bạn nhỏ mà mình đã hướng dẫn lúc đi làm. Hồi mới toanh đó mình hay ngại lắm, cái gì cũng cặm cụi làm mà không dám hỏi, cho tới khi trễ mất tiêu, sếp hỏi thì rối cả lên, đành nói là em không biết làm. Sếp căng thẳng vì thời gian đã gấp lại còn vừa phải làm việc của mình, vừa hướng dẫn cho mình. Mình không còn là con bé mới toanh đó nữa. Mình đã biết là lúc đi làm thì mình cũng không phải làm một mình, mà làm chung với một nhóm. Thảo luận, cập nhật tình hình cho nhau, cả những điều mình rõ và không rõ, sẽ giúp nhóm giải quyết vấn đề nhanh hơn.
Email đã gửi ra rồi, và mình lại cặm cụi tiếp đây 😉
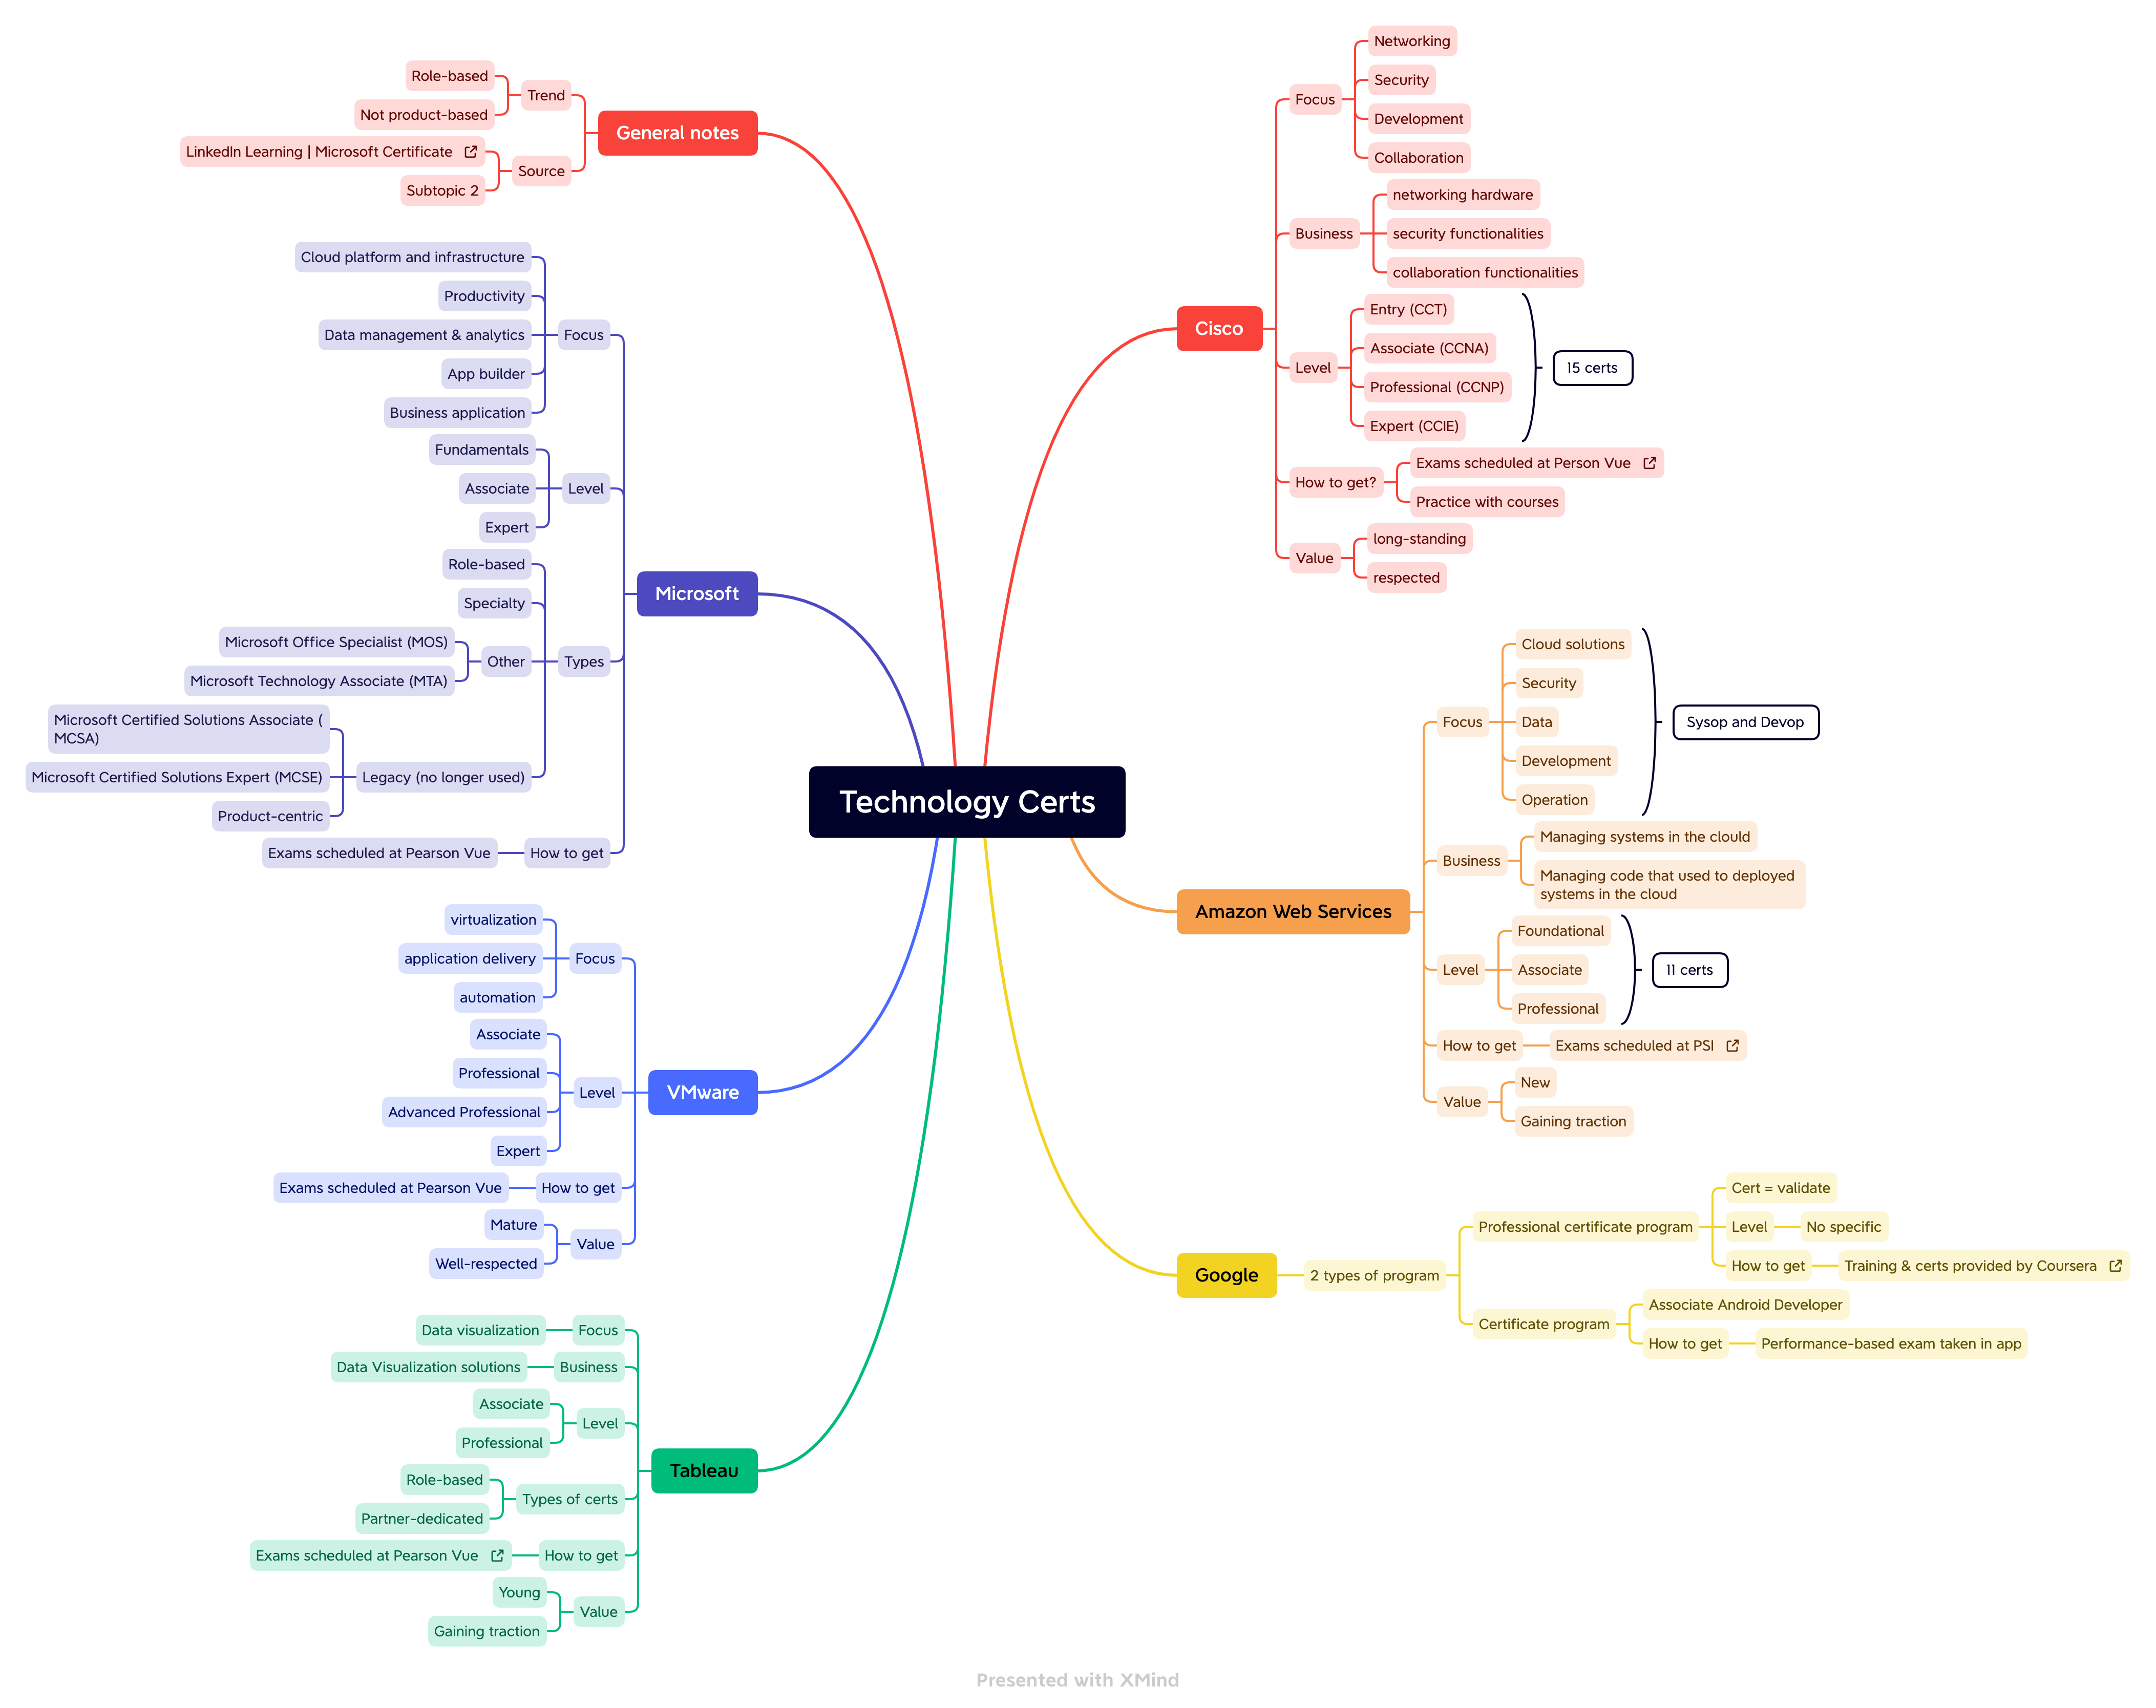
Mindmap trên được tổng hợp từ một phần trong khóa học giới thiệu về các chứng chỉ của Microsoft. Đánh giá chung của mình là:
Xu hướng hiện nay là bớt các chứng chỉ product-based, nhiều chứng chỉ role-based. Tuy nhiên nói gì thì nói, công cụ được dùng để minh họa vẫn là đồ của nhà đó thôi 😀
Microsoft gần như trận địa nào cũng góp mặt, cập nhật liên tục đến mức khó mà theo cho kịp.
Google thiên về hướng tổng quan, sơ sơ. Học miễn phí (dạng audit) trên một nền tảng đã quen thuộc như Coursera là một hướng rất mở cho anh em tiếp cận. Giá lấy chứng chỉ cũng phải chăng.
Amazon Web Services đang được anh em IT quanh mình rất được ưu ái.
Cisco, VMware => ???
Phần kế mình sẽ đi tổng hợp các chứng chỉ dành cho nhóm ngành Data 😀
To complete any project of any lasting importance in people analytics, you have to master concepts and activities that live in many different domains. This cheat sheet provides some information about these domains, concepts, and activities.
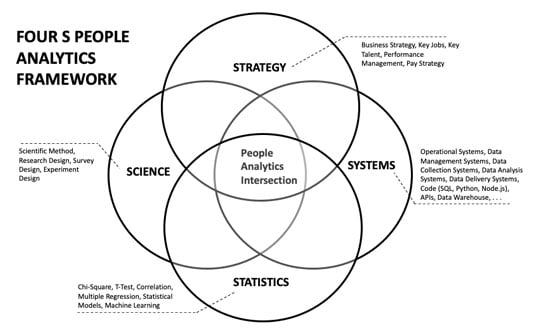
The Four S People Analytics Framework
One way of defining people analytics is to say that people analytics is what lives at the intersection of people strategy, science, statistics. and systems — what I like to call the Four S’s. (See the following figure.) If you take any of the S’s away, you might get something like people analytics, maybe even a precursor of people analytics, but it is not people analytics proper.
The Four S People Analytics Framework (The People Analytics Intersection).
Following are some ingredients to each of the Four S components that represent an important concept or activity to learn if you hope to be successful at people analytics:
Strategy
Strategy encompasses the plans and policies intended to help a company gain a sustainable edge over its competitors as efficiently as possible. It represents the art and science of developing and using the object and actions within control of an organization in a deliberate manner in order to increase the probabilities of victory and to lessen the chances of defeat.
Concept
Description
Business Model
Business models are frameworks that describe how a business creates value. The areas of focus of a business model include: problem focus, target customer focus (market), unique value proposition, channels, methods of generating revenue, total addressable market (projected target customer market estimates), projected costs, projected revenues, and any believed or real defendable product differentiation advantages. The work we do in people analytics is intended to support the organization in creating, adapting, or defending a specific business model.
Segments, Target Segments
Segments are groups of people who exhibit similar attributes or characteristics. Segments must be distinct from other groups. Segments need not be demographic in nature — segments may consist of individuals who share a similar response to survey questions or display common behavioral patterns in reaction to some stimulus. The concept of target segments is of central importance to marketing; in people analytics, we look to apply this same concept to human resources. In people analytics you also look to make Human Resources serve the interests of what the organization is trying to represent to its target market segments.
Differentiation
Product differentiation (or simply differentiation) is the process of distinguishing a product or service from others in order to make it more attractive to a particular target market segment. In people analytics, we are interested in those key jobs, competencies, attitudes, and behaviors that must be created to help the company create and sustain its product leadership in the marketplace in some category of product differentiation.
Job Families and Job Levels
A job family is defined as a set of jobs (with or without related titles) that share a series of related knowledge, skills, abilities, and other characteristics (competencies). Job families can be further classified by level, defining a progressive expression of the job family’s contributions to a business.
Key Jobs and Key Talent
Key jobs or key talent are those jobs or people that are critically important for a particular business model. They demonstrate the differentiating competencies (knowledge, skills, abilities, and others defined characteristics) that are pivotal to affect the success of a particular business model and product differentiation strategy.
Performance Management
Performance management is a human resource management strategy and operational process that aims to align employee expectations and actions with the expectations of managers and company leadership with the objective of improving individual and collective performance. Performance management is a process for evaluating employee performance in reference to the competencies, attitudes, and behaviors previously demonstrated as critical for successful job, team, or company performance. Group facilitated exercises such as the Critical Incident Technique may be combined with other forms of data to derive a valid and reliable measurement system that can be applied to employee selection and ongoing feedback in support of the broader context of performance management and business strategy.
Compensation Philosophy and Compensation Strategy
Compensation philosophy or strategy represents the standards, goals, and plans by which those responsible for employee compensation will help the company prioritize available budgets to achieve the goals of the company through better control over employee attraction, motivation, and retention. Some of the various concepts that can be applied and measured include internal equity and fairness (similarity in pay among similar jobs), market differentiation (comparison to pay at other companies), and how the company chooses to compensate differently for different experience, competency, tenure, performance and job importance.
Science
Science involves the systematic study of the structure and behavior of the physical world through the organization of facts and theories and continual refinement of those facts and theories through observation and experiment.
Concept
Description
Scientific Method
The scientific method is a body of techniques for investigating the world, acquiring new knowledge, or correcting previous knowledge consisting in systematic observation, measurement, and experiment, and the formulation, testing, and modification of hypotheses.The scientific method is an iterative process involving the following steps:1. Make observations2. Identify questions3. Formulate hypotheses. Develop testable predictions4. Conduct an experiment. Gather data to test predictions5. Analyze data6. Refine, alter, expand or reject hypothesis (either go on to 7 or go back to 3)7. Develop or alter general theories.
Inductive Analysis
Inductive reasoning begins with detailed observations of the world and from these moves towards generalizations and theories of what they mean. When following an inductive approach, beginning with a given set of data, a researcher identifies relationships, developing theories as she proceeds. No hypotheses can be found at the initial stages of the research and the researcher is not sure about the type, nature or application of the research findings until the study is completed.
Deductive Analysis
Deductive reasoning starts with a general theory, statement, or hypothesis and then works its way down to a conclusion based on evidence. The main difference between inductive and deductive approaches to research is that whilst a deductive approach is aimed and testing theory, an inductive approach is concerned with the generation of new theory emerging from the data.
Research Design
A research design is the set of methods and procedures used in collecting and analyzing measures of the variables specified in a problem theory. The research design defines the study type (e.g. review, descriptive, correlational, experimental or meta-analytic) and sub-type (e.g. longitudinal, cross-section, cohort, . . .), research problem, hypotheses, independent and dependent variables, experimental design, and, if applicable, data collection methods (survey, systems, ….) and a statistical analysis plan. A research design is a framework that has been created to find answers to research questions.
Survey Design
Survey design is a sub field of applied behavioral science using questionnaires. Important elements of survey design include decisions about the technique of survey data collection, the technique to select a sample from a population, and the mathematical techniques for accurately interpreting what is found.
Experiment Design
Experimental research is any research conducted with a scientific approach, where a set of variables are kept constant while the other set of variables are being measured as the subject of experiment change. Experimental research is the gold standard for investigating causal (cause/effect) relationships empirically. You can use experimental research to compare one group to itself over time or two groups two each other. In all designs, independent variables (X) are manipulated to see if it the change or difference between the samples (or groups) has an effect on the dependent variable (Y), generally using t-tests (see statistics). In contrast, an observational study does not involve experimental manipulation.Experimental research is used to test hypotheses. A hypothesis is a testable statement that is formulated by the researcher to confirm a theory or address a specific question. The researcher’s job is to design an experiment that will support or disprove the hypothesis.
Statistics
Statistics is the branch of mathematics that deals with the collection, organization, analysis, and interpretation of numerical data.
Concept
Description
Chi-Square
A statistical significance test used for variables that have been organized into categories and presented in a crosstab or contingency table. A cross-tab displays the frequency distribution of the two or more variables crossed against each other. When you summarize two categorical variables in a cross-tab, your implicit interest is “Are the two variables related or independent?” Chi-Square is a statistical technique that can be applied to assess this very question.
T-Test
A statistical method of assessing the significance of differences between two mean values for the same variable. The t-test is a statistical method often used in experimental design when comparing groups or samples for purposes of determining the impact of some change.
Correlation
Correlation is a statistical technique for determining the statistical relationship between two variables. In other words, if we are measuring two variables and one variable increases, does the other consistently increase at some related amount?
Multiple Regression
Multiple regression is employed to understand how multiple independent variables (x) are statistically related to the dependent variable (y) and to what degree. It helps mathematically describe the form of the relationships between multiple variables (x1, x2, x3) and (y), it helps to mathematically determine how good the overall model (inclusion of all variables) is at describing or predicting the behavior of (y), and it helps to mathematically isolate the independent contribution of each (x) variable to the total variance in (y).
Factor Analysis
Factor Analysis is a statistical technique that is useful for organizing and understanding datasets where there are high numbers of observed variables that are believed to reflect a smaller number of underlying variables. The research questions factor analysis can help you answer include:How can we better understand and classify the variables in a dataset based on the observed interdependencies?Based on the observed interdependencies, what variables in this data can be combined into a single factor? For example, can performance at running, ball throwing, batting, jumping, and weight lifting be combined into a single factor such as general athletic ability?Based on the observed interdependencies, what are the most important variables in this dataset?Based on the observed interdependencies, do survey items (or other measurement instruments) measure what they purport to measure?
Machine Learning
Machine learning is the application of computer algorithms to build a mathematical model of sample data (known as training data) in order to make predictions or decisions without being explicitly programmed to perform the task.
Systems
A system is computer software designed to perform a group of coordinated functions, tasks, or activities for the benefit of the user. A system is made up of components that work together. A system takes an input, changes it according to the system’s use, and then produces an outcome. Inputs and outputs are strung together between systems to accomplish broader objectives.
Concept
Description
Operational Systems
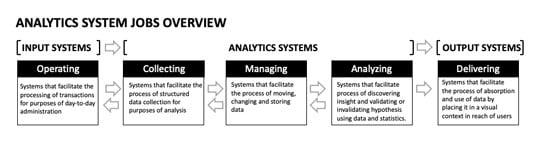
The systems that facilitate the processing of transactions necessary for the day-to-day administration of the company.
Data Collection Systems
Systems that facilitate the process of structured data collection for purposes of analysis.
Data Management Systems
Systems that facilitate the process of moving, changing, and storing data.
Data Analysis Systems
Systems that facilitate the process of discovering insight and validating or invalidating hypotheses using statistics.
Data Delivery Systems
Systems that facilitate the process of absorption and use of data by placing it in a visual context in reach of users.
Data Warehouse
A data warehouse is a central repository of integrated data from one or more disparate sources. A data warehouse is a data management sub-system and is considered to be a core component of business reporting and analysis.
Operational Data Stores and Analytical Data Stores
Operational data stores consist of a method of storing transactional data that is built for the integrity and efficiency of the operational application where the data stemmed from — normalized tables, for example. In contrast to operational data stores, analytical data stores use methods of storing data that are built for the integrity and efficiency of reporting and analysis — through de-normalized columnar design, for example. In the case of statistical analysis, the data must be put in a specific columnar format dictated by the statistical procedure. In other cases, the design of the dataset is for faster query performance.
Data Visualization
Data visualization is the process of putting numerical data in a pictorial or graphic format. Data visualization helps users comprehend information quickly and spot patterns, trends, and correlations in the data without abstract ideas or mathematics. Data can be visualized in a wide range of applications, but some applications are designed to allow the user to change the design of graphs, filter graphs, or drill down into graphs so that through exploration they can obtain the answers to their own questions.
Data Dashboard
Generally, a data dashboard is understood to be the output of a data delivery system that displays together two or more metrics visually so that the user can monitor some measurable features of a business, department, or process. A popular data visualization expert, Stephen Few, defines a dashboard more specifically as “a visual display of the most important information needed to achieve one or more objectives; consolidated and arranged on a single screen so the information can be monitored at a glance.”
API
API stands for Application Programming Interface. An API is an interface designed into an application that allows other applications to communicate with it. In other words, an API is the messenger that can deliver a request to a system and then deliver the response back. The ability to communicate with application APIs in order to get data and move it to where it is needed is of growing importance to analytics.
Code (SQL, Python, Node.js)
Structured Query Language (SQL) is a standard computer language for relational databases and for performing various data operations. The software is coded to query, join, merge, update, and modify data. As a relational data system, it is comprised of a set of tables with columns and rows that contain data. As the original code for databases, SQL excels at accessing and organizing data, is relatively easy to learn, and is thus almost common knowledge among coders.Python is a general purpose, high-level coding language that has long been used to develop software on the web and in apps; in recent years, however, it has found increasing popularity among professionals who work with data. Python was designed to empower its users, emphasizes code readability, and leverages syntax that allows programmers to accomplish tasks in fewer lines of code than prior languages. Python users tout its use due to its easiness to learn, the accessibility of the language, its expansive library of open source data tools and testing instruments.Node.js is an open-source, cross-platform JavaScript run-time environment that executes JavaScript code outside of a browser. Node.js supports web applications with real-time, two-way connections, where both the client and server can initiate communication, allowing them to exchange data freely. Consequently, Node.js unifies web application development around a single programming language (JavaScript) rather than different languages for server side and client-side scripts. Node.js shines in real-time web applications employing push technology rather than WebSocket’s. Node.js is useful for developing data applications designed to run on the web and for extracting and moving data between web applications.
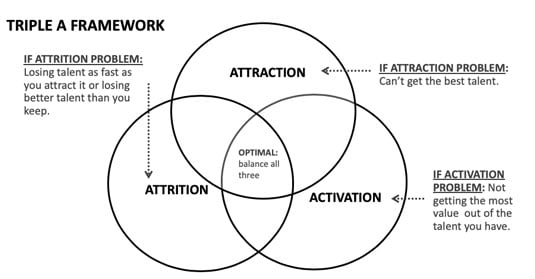
The Triple A Measurement Framework
The Triple A Measurement Framework (see the following figure) provides the fundamental measurements and analysis for the three big people-related problems each company needs to solve if they hope to grow as a business: attracting talent, activating talent, and controlling the rate of talent exit (attrition).
The Triple A Measurement Framework
Attraction
Attraction represents a set of metrics and analyses intended to measure the attractive force of the company to acquire the quality of talent it wants. In other words, it poses the question “How are you doing on getting talent into the company?”
Concept
Description
Headcount-SOP
The number of people in a segment at the start of the selected time period.Calculation: [Period].[Segment].(count of active employees on the first day of the period)
Headcount-EOP
The number of people in a segment at the end of the selected time period.Calculation: [Period].[Segment].(count of active employees on the last day of the period)
Average Headcount Simple
The average number of people in a segment during the selected time period, calculated with a count at the beginning and end divided by two.Calculation: Period].[Segment].Headcount-SOP + [Period].[Segment].Headcount-EOP ÷ 2
Hires
A hire is someone who was not an employee that became an employee. As a metric, hires is a count of the number of hires in a particular segment in a particular time period.Calculation: [Period].[Segment].(count number of hires)
Hire Rate
The number of hires in a segment during the reporting period expressed as a percentage of that segment’s average headcount in that reporting period.Calculation: [Period].[Segment].Hires ÷ [Period].[Segment].Average-Headcount-Simple × 100
Headcount Growth
The increase in the number of employees in a segment from the start of the period to the end of the period. Calculation: [Period].[Segment].Headcount-EOP – [Period].[Segment].Headcount-SOP
Headcount Growth Rate
The growth in the number of people in a segment during the selected time period expressed as a percentage of headcount at start of period.Calculation: [Period].[Segment].Headcount-Growth / [Period].[Segment].Headcount-SOP ×100
Headcount Plan
A particular segment’s headcount plan on a particular date.Calculation: [Period].[Segment].(sum of headcount plan)
Headcount Plan Achievement Percent
A particular segment’s headcount as a percentage of that segment’s headcount plan on a particular date, expressed as a percentage.Calculation: [Period].[Segment].Headcount-EOP / [Period].[Segment].Headcount-Plan ×100
Candidates
Candidates are people who are considered for open jobs. A candidate may apply for multiple jobs and therefore may have multiple applications. As a result, there are typically more applications than there are candidates. As a metric, candidates is a count of the number of candidates in a particular segment in a particular time period.Calculation: [Period].[Segment].(count the number of candidates)
Applications
Applications are formal requests to be considered for an open job. As a metric, applications is a count of the number of applicants in a particular segment in a particular time period.Calculation: [Period].[Segment].(count the number of applications)
Interviews
Interviews are when the people who will participate in the hiring decision formally assess a candidate for decision. As a metric, interviews is a count of the number of interviews in a particular segment in a particular time period.Calculation: [Period].[Segment].(count the number of interviews)
Offers
The number of job offers in a selected period. Offers are when a candidate has been selected and a formal invitation has been given to the candidate to join the company.Calculation: [Period].[Segment].(count the number of offers)
Offer Accepts
The number of candidates with offers who have accepted those offers.Calculation: [Period].[Segment].(count the number of offers accepted)
Recruiting Stage Pass Percent
The percentage of applicants that pass from a defined recruiting stage to the next recruiting stage, by segment, by period. In this example, Stage1 = phone screen. Stage2 = onsite interview.Calculation: [Period].[Segment].Stage2.Applicants ÷ [Period].[Segment].Stage1.Applicants × 100
Segment Yield-Percent
The percentage of applicants that make it through all recruiting stages and then accept an offer, by segment, by period.Calculation: [Period].[Segment].Offer-Accepts / [Period].[Segment].Applicants × 100
Average Hires per Recruiter
The average number of hires made per recruiter in a given period.Calculation: [Period].[Segment].Hires [Period].[Segment].Recruiter.Average-Headcount-Simple
Average Phone Screens Per Hire
The average number of phone screens it took to make a hire in a given period.Calculation: [Period].[Segment].Phone-Screens [Period].[Segment].Hires
Average Interviews Per Hire
The average number of interviews it took to make a hire in a given period.Calculation: [Period].[Segment].Interviews [Period].[Segment].Hires
Average Time to Fill
The average number of days elapsed between the date a job requisition is approved and the applicant offer accept date.Calculation: [Period].[Segment].(sum of days between job requisition date and offer accept) [Period].[Segment].Offer-Accepts
Average Time to Start
The average number of days elapsed from the date a job requisition is approved to the date a new hire begins work.Calculation: [Period].[Segment].(sum of days between job requisition date and employee start date) ÷ [Period].[Segment].Hires
Average Time to Start Candidate View
The average number of days elapsed between an application start date and the date a new hire begins work.Calculation: [Period].[Segment].(sum of days between application start date and employee start date) ÷ [Period].[Segment].Hires
Brand Index
A survey key performance indicator (KPI) calculated from survey items designed to measure company brand recognition among a target candidate segment in a given period.
Activation
Activation represents a set of metrics and analyses intended to measure the proportion of people and teams who have all the basic requirements to produce at a high-performance level. In other words, it poses the question “How are we doing at creating the conditions that make for productive employees?”
Concept
Description
Human Capital ROI (HCROI)
Pretax profit for each dollar invested in employee pay, including cash compensation, benefits, and equity compensation.Calculation: (Revenue – (Total Cost – (Regular Compensation Cost + Total Benefit Costs))) / (Regular Compensation Cost + Total Benefit Costs).Alternate Calculation: (Profit ÷ average number of employees) ÷ (Employee Cost ÷ average number of employee)
Expected Employee Lifetime Value (ELV)
Expected employee lifetime value (ELV) is a measurement of the estimated financial value (profit) that an employee brings to an organization over their entire lifetime of working for the company. In this calculation, the employee lifetime is the period that starts when an employee first joins your business and ends on that person’s last day. You can calculate ELV by individual, by segment, or by average.Calculation: 1) Calculate (HCROI), 2) Calculate average annual compensation, 3) Calculate (or estimated) average tenure, 4) multiply it out: (HCROI) × (Annual Compensation) × (Lifetime Tenure). You will get a large dollar value.
CAMS Index
A survey key performance indicator (KPI) calculated from survey items designed to infer the presence of four conditions: capability, goal alignment, motivation, and support (CAMS). There are 8 items and each item has a possible score of 0 to 10, resulting in an index that ranges 0–80.
Activated Percent
Estimated percentage of a segment that is activated in a given time period. Count the number of people who have responded positively enough to the eight CAMS items to be considered “activated” (CAMS index equal to or greater than 70) then divide by the number of survey responses in the segment and multiple by 100. Calculation: (# activated in segment) ÷ (total survey responses in the segment) × 100
Net Activated Value (NAV)
Net Activated Value combines ELV and Activated Percent into a single metric. NAV discounts the expected value of a segment, taking into consideration that because not all employees are activated, the segment can’t possibly deliver full value. Segment NAV = (Segment Activated Percent) × (Segment ELV).
Culture
Organization culture may be thought of simply as a “corporate personality.” Culture is the shared values, beliefs, and unstated rules that influence the behavior of people as members of an organization. Culture and cultural congruence can be measured through survey items. An example provided in People Analytics For Dummies is the OCAI.
Climate
Organizational climate is a measurement of the patterns of opinion, attitudes, and feelings that characterize people’s perception of life in the organization at a particular time and context. You quantify organizational climate using surveys, usually by first listing a variety of experiences or ideas as a series of statements and then measuring agreement or disagreement with these statements.
Attrition
Attrition represents a set of metrics and analyses intended to measure the degree of control the company has over the quality of the talent it’s able to retain versus the quality of talent it allows or encourages to exit. In other words, it poses the question “How are you doing keeping your highest performers, while letting others go on to the next stop in their career?”
Concept
Description
Exits
An exit is someone who was an employee that leaves the company and is no longer an employee. As a metric, exits is a count of the number of exits in a particular segment in a particular time period.Calculation: [Period].[Segment].(count number of company exits)
Exit Rate
The number of employee exits from a segment during the reporting period as a percentage of segment average headcount.Calculation: [Period].[Segment].Exits ÷ [Period].[Segment].Average-Headcount-Sample × 100
Voluntary Exit Rate
The number of employees who exited during a timeframe, with a specific exit classification type = voluntary.Calculation: [Period].[Segment].[Voluntary].Exits ÷ [Period].[Segment].Average-Headcount-Sample × 100
Involuntary Exit Rate
The number of employees who exited during a timeframe, with a specific exit classification type = Involuntary.Calculation: [Period].[Segment].[Voluntary].Exits ÷ [Period].[Segment].Average-Headcount-Sample × 100
Regretted Exit Rate
The number of employees who exited during a timeframe, with a specific exit classification type = Voluntary & Regretted (Voluntary-Regretted). Regretted may be defined as anyone with a performance rating greater than average.Calculation: [Period].[Segment].[Voluntary-Regretted].Exits ÷ [Period].[Segment].Average-Headcount-Sample × 100
Retention Rate
The percentage of all employees that started the time period that did not exit the company in the time period.Calculation: [Period].[Segment].(count of people who start period who are still active employees at end of period) ÷ [Period].[Segment].Headcount-SOP × 100
Commitment Index
A survey key performance indicator (KPI) calculated from survey items designed to measure organizational commitment among a segment in a given period.
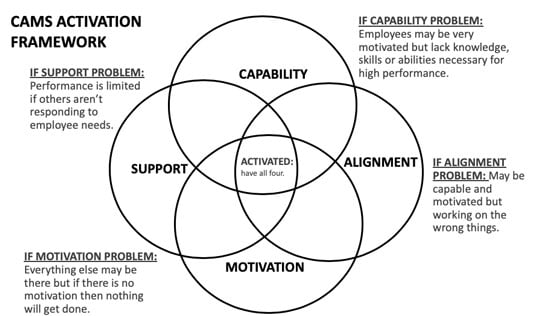
CAMS Activation Index Framework
The theory of activation proposes that, taken down to its essence, four conditions must exist for an employee or a team to consistently produce at or above performance expectations. The employee or team must: a) be capable of performing the actions required (Capability), b) be aligned on what a good result looks like (Alignment), c) be motivated to perform the actions (Motivation), and d) have all the tools and support that are required for successful performance of those actions (Support). (See the following figure.)
The CAMS Activation Index Framework
If any of the four essential conditions (Capability, Alignment, Motivation or Support) is missing, it’s difficult, if not impossible, for the employee or team to perform reliably. For more details on what each condition is and how it is measured, see below.
Capability
In its most basic sense, an individual who is capable has the knowledge, skills, ability, and other characteristics necessary to perform the job. Capabilities are what people bring to the company — personal qualities such as technical knowledge, learning agility, social skills / emotional quotient (EQ), and grit, for example.
Scale: Measured by agreement using a scale of 0 (Strongly Disagree) to 10 (Strongly Agree):
Concept
Description
Team Capability
My primary work group has all the capabilities it needs right now to achieve top performance as a team.
Individual Capability
I have the capabilities I need right now to achieve top performance in my current role right now.
Alignment
Employees who are aligned know what they’re expected to accomplish, under what conditions, and how they’re performing in relation to those expectations. The company can increase alignment by way of goal setting, performance appraisal, and regular executive, manager, and employee communication.
Scale: Measured by agreement using a scale of 0 (Strongly Disagree) to 10 (Strongly Agree):
Concept
Description
Team Alignment
There is a clear objective around which myself and the people I work with rally.
Individual Alignment
I have a clear understanding of the difference between an average contribution and a great contribution for my role.
Motivation
Motivation is the general desire or willingness of someone to do something. Motivation reflects the interaction of personal preferences with the job, working environment, company culture, leadership, managers, peers, rewards, and incentives, which result in motivation or demotivation to perform the tasks at hand.
Scale: Measured by agreement using a scale of 0 (Strongly Disagree) to 10 (Strongly Agree):
Concept
Description
Team Motivation
The people I work with are willing to help even if it means doing something outside of their usual activities.
Individual Motivation
I am motivated to do more than the minimum expectations.
Support
This category covers not only the particular technical tools used to perform work but also any other support that’s necessary, such as access to documentation, access to manager and teammates to help solve problems, resources designed to produce skills and knowledge in the individual, technical support, and camaraderie. (For , use the name of your own organization.)
Scale: Measured by agreement using a scale of 0 (Strongly Disagree) to 10 (Strongly Agree):
Concept
Description
Team Support
I have the cooperation and support from others at I need to be successful.
Individual Support
I have the resources and tools I need to be successful.
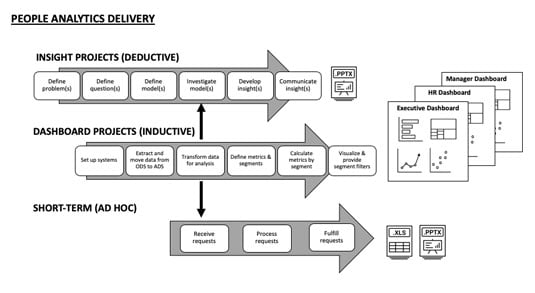
People Analytics Delivery
The following figure illustrates how both deductive and inductive analysis approaches can be incorporated in a people analytics delivery model.
Your People Analytics Delivery Model may include both deductive and inductive approaches.
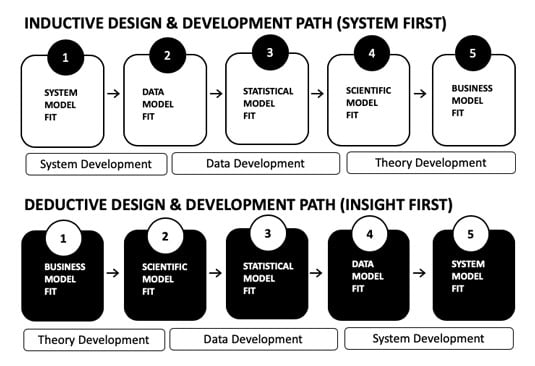
People Analytics Design & Development
The following figure illustrates how deductive and inductive people analytics design & development workflows contrast.
The Five Models of People Analytics may be organized for both inductive and deductive approaches.
People Analytics System Jobs Overview
The following figure provides a high-level overview of the five essential jobs of technology systems in analytics.
Analytics Systems Jobs Overview
About the Book Author
Mike West was a founding member of the first people analytics teams at Merck, PetSmart, Google, and Children’s Health Dallas before starting his own firm, PeopleAnalyst, LLC. He has helped companies large and small design people analytics applications and start their own people analytics teams. Mike brings a unique perspective about how to use data to create winning companies and great places to work.
Em ơi, chị thấy khóa này về chủ đề X hay quá nè, mà chị đang phân vân về giảng viên, không biết là có hợp với chị hông. Em có kinh nghiệm gì có thể chia sẻ về việc review khóa học không?
(Đính kèm đường link tới một khóa học trên Coursera)
Đáp:
Hello chị, việc chọn một khóa học để học, có thể xem tương đương với việc đi mua một món đồ hay một sản phẩm dịch vụ để đáp ứng một nhu cầu nào đó. Như vậy,
Bước 1, ta cần xác định:
Nhu cầu của bản thân: Mình muốn học gì, phạm vi đến đâu, budget thế nào…
Thị trường đang cung cấp gì, đáp ứng nhu cầu của ta đến đâu.
Với mục số 1, nếu là để đáp ứng nhu cầu công việc, có thể tham khảo:
Job description
Job post
Các thông tin này rất sẵn trên các trang tuyển dụng. Lấy tầm 5-10 mẩu tin, gạn lọc từ khóa, ta sẽ có được một cái nhìn khá bao quát về nhu cầu của thị trường đối với ngành nghề đó.
Với mục số 2, ta có thể tìm kiếm các khóa học đang có trên thị trường dựa trên bộ từ khóa đã có.
Bước 2, sau khi đã xác định rõ nhu cầu, các option thị trường cung cấp, ta có thể lập một bảng so sánh:
Bước 3: Ra quyết định
Tóm lại:
Xác định nhu cầu của bản thân
Xác định cái thị trường cung cấp
Xác định các tiêu chí, lập bảng so sánh
Chọn lựa dựa trên các tiêu chí đó
NHƯNG…
Có một chữ “nhưng” rất to! Quy trình thông thường là như trên, nhưng câu chuyện này lại rẽ sang một hướng khác. Nhờ Design Thinking hôm bữa nên mình áp dụng zô luôn!
Có vẻ chị quan tâm nhiều đến giảng viên, vậy giảng viên như thế nào sẽ khiến chị không thích ạ?
À, chị quan tâm cách truyền đạt của giảng viên, cùng 1 kiến thức nhưng mỗi người có 1 cách truyền đạt và dẫn dắt khác nhau. Chị không thích khóa học mà không có bài tập thực hành và tương tác trực tiếp, nên chị khá là ngại ngần với các course online.
(Nghĩ thầm: vậy mà chị kêu em đi review khóa học online!)
Vậy là chị thích offline interaction, chứ không phải đang cân nhắc giữa các giảng viên online?
Ừa. Chị follow thầy A kia cũng khá lâu, người đó truyền cảm hứng lắm. Nhưng để học được lớp của thầy thì phải qua Mẽo, học phí cũng khá khẩm. Kiểu mình có 1 cái favourite nhưng mình chưa đủ điều kiện để đáp ứng, nên quay qua alternative option thì mình ko mấy mặn mà…
Vậy chị muốn học từ người thầy đó, hay là học kiến thức đó?
Trong trường hợp này thì có lẽ là học từ người thầy đó hơn là kiến thức
Nếu vậy thì cách tiếp cận có lẽ sẽ khác đi rồi. Theo em thì, để gần người đó (tiện thể học) thì mình có nhiều cách khác chứ không cần chỉ đi học. Ví dụ, gửi mail cho người đó, bày tỏ lòng ngưỡng mộ và xin một chân phụ dự án của người đó, kết nối với một nhóm để tổ chức một buổi online conference… Nếu vẫn muốn đi học, thì làm một bản dự toán chi tiết xem hết bao nhiêu, nếu khóa học thật sự có giá trị thì cũng rất đáng để lên kế hoạch dài hơi cho nó 😀
Ừa, chị sẽ nghiêm túc review lại các lớp online, và tìm thầy offline tốt hơn nếu có thể. Chị cũng không vội, miễn là tìm được thầy phù hợp.
Mình học được gì qua câu chuyện trên?
Cái người ta hỏi chưa chắc là cái người ta thật sự cần
Chỉ đưa công cụ cho người thật sự cần công cụ đó, nếu không sẽ là gánh nặng cho họ